
A Hitchhikers Guide to Compiling

The C language is arguably the most popular and widely used language of all time. We all know that when we run a C program, the code is converted to machine code and then executed on the machine. But have you ever wondered how this happens? How does a text file with English commands such as printf and scanf gets converted to 1's and 0's? In this post, we shall see how a compiler converts the C code into an executable file.
So what happens when you execute a C program? Let's go through it step by step. Write a C program as follows.
#include <stdio.h>

int main() {
   printf("Hello, World!\n");
   return 0;
}
This is a simple hello world program right here. To compile it and run it on our system we will use the Clang compiler which is used to compile C programs to machine code. To compile our program we can run the following command.
clang main.c -o main
./main
Running the command above should print "Hello world" on our screens.
So what happened here? The clang command seems to have taken our source code file and magically produced an executable main which when called prints "Hello World". Clang simplifies compiling C code to machine code. It abstracts a ton of chores behind a simple command. We can unwrap the process and analyze what happens when we run the compilation command.
The compilation process can be mainly divided into 7 stages as shown in the diagram below.
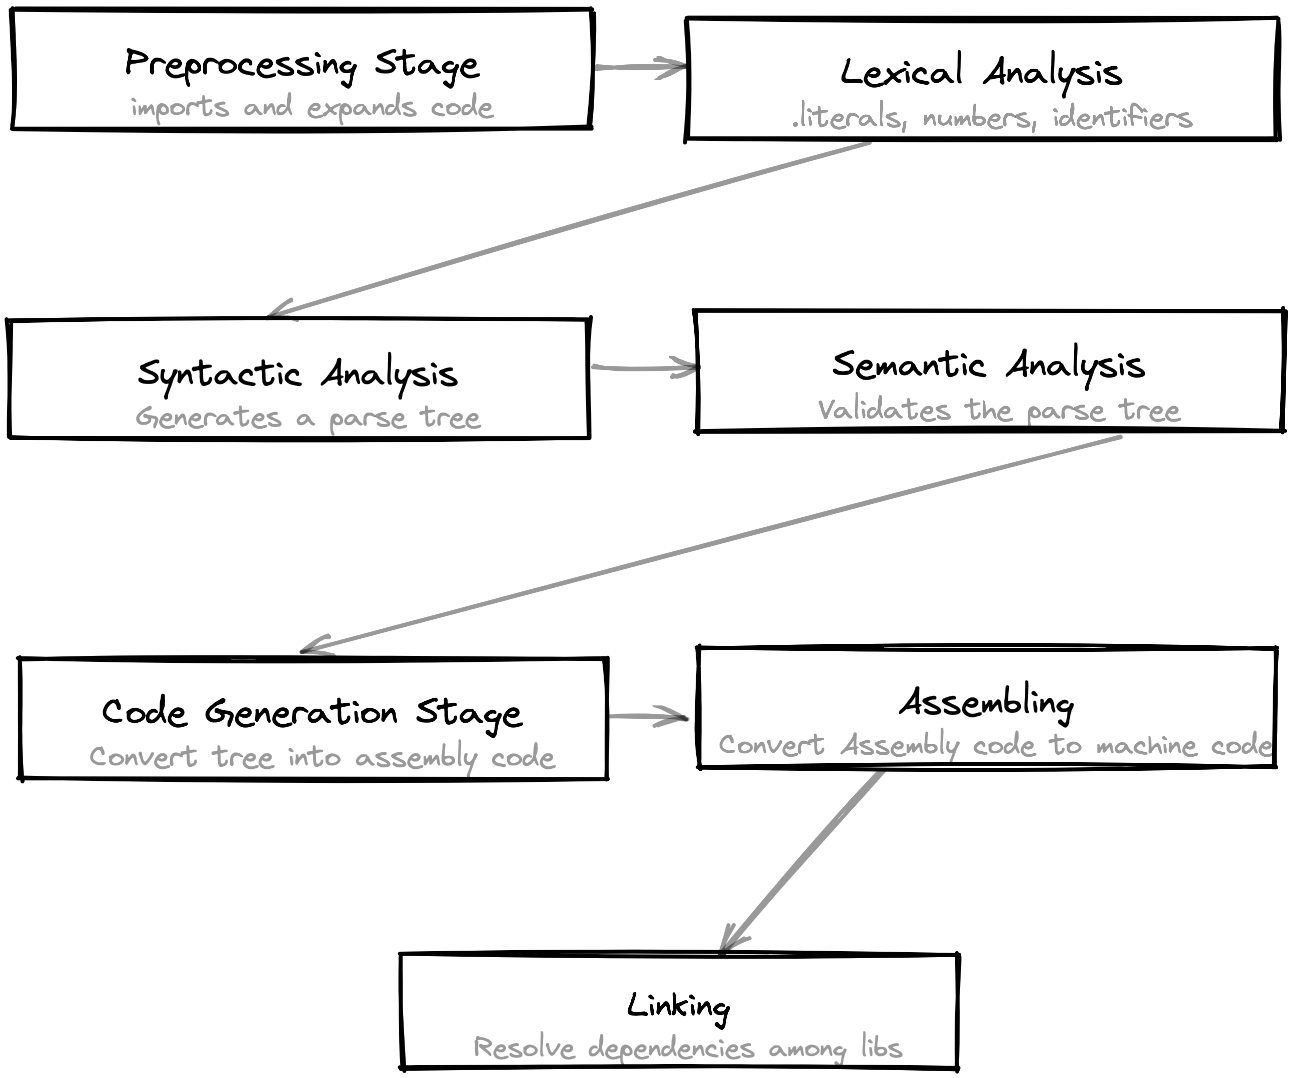
Let's begin with the first one.
Preprocessing
The first stage in the compilation process is the pre-processing stage. This stage expands the macros within the file, imports code from included libraries, and removes comments from the source code. The clang compiler provides an -E flag that can be passed in while compiling the code. This flag halts the compiler after the pre-processing stage and outputs the preprocessed output of the file. Let's run the command on the hello world program above and store the output in main.i.
clang -E main.c -o main.iYour directory should now have a main.i file. You can compare the size of the two files using the ls -lh command. On my system the main.c file was 98 bytes while the main.i file was 23KB. A staggering 23933.7% increase in the file size. This is due to the declarations from stdio.h being copied to main.c file. Notice the comments and macro definitions within the file have been removed. The macros are now replaced with the actual values themselves.
You can also see a ton of lines like these:
# 2 "main.c" 2
# 1 "/Library/Developer/CommandLineTools/SDKs/MacOSX.sdk/usr/include/stdio.h" 1 3 4
# 64 "/Library/Developer/CommandLineTools/SDKs/MacOSX.sdk/usr/include/stdio.h" 3 4
# 1 "/Library/Developer/CommandLineTools/SDKs/MacOSX.sdk/usr/include/_stdio.h" 1 3 4
# 68 "/Library/Developer/CommandLineTools/SDKs/MacOSX.sdk/usr/include/_stdio.h" 3 4
These are called linemarkers. Linemarkers are used by the compiler for debugging purposes. They help the compiler specify which lines within which file is responsible for the error. The format for linemarkers is the following:
# linenum filename flags
The linemarkers provide a file reference to the compiler of the source code proceeding it via a linenum in a particular filename. The sequence of different files denotes the included hierarchy within files ( sort of like the stack trace ). To test the linemarker information you can pick the last line marker in a group and visit the file by the given path and compare the code at the given line number.
I would suggest you create a new C file with a dummy function and include it within main.c and then check the preprocessor output of main.i.
Lexical Analysis
Now that the preprocessed code is ready, the compiler reads the code and breaks down the syntax into tokens. This helps the compiler parse the program and build an execution tree.
The process of breaking down our program into small bits is called tokenization. The tokenization process converts the stream of characters within a file into a collection of tokens, assigning a type identifier to every token. Parsing text like this helps ease the compiler's job to interpret the program by converting text to a collection of data structures. You can see them by running the following command.
clang -fsyntax-only -Xclang -dump-tokens main.c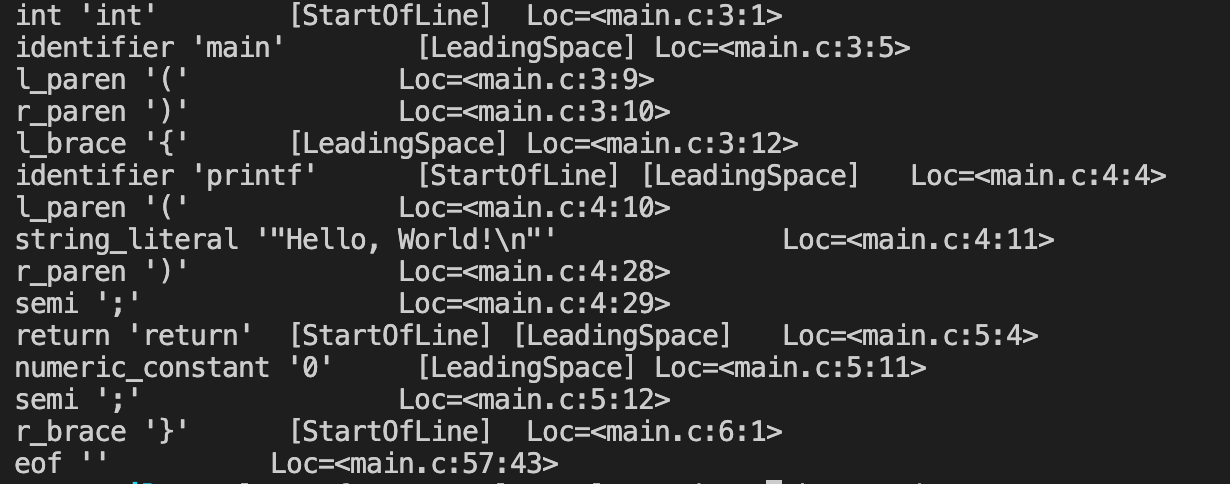
Syntactical Analysis
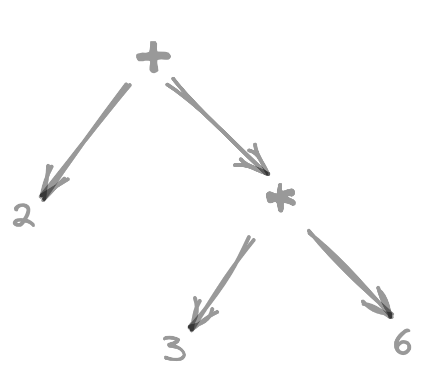
Once the compiler has generated the tokens, it moves on to parse them and creates an abstract syntax tree representing the flow of the program. The tree generation stage is crucial for the program to decide which operations get precedence over the other. For example: 2 + 3 * 6 will generate a tree-like this as the * operator has higher precedence.
The -ast-dump flag outputs an AST to the console and provides a glimpse of the execution flow of the program.
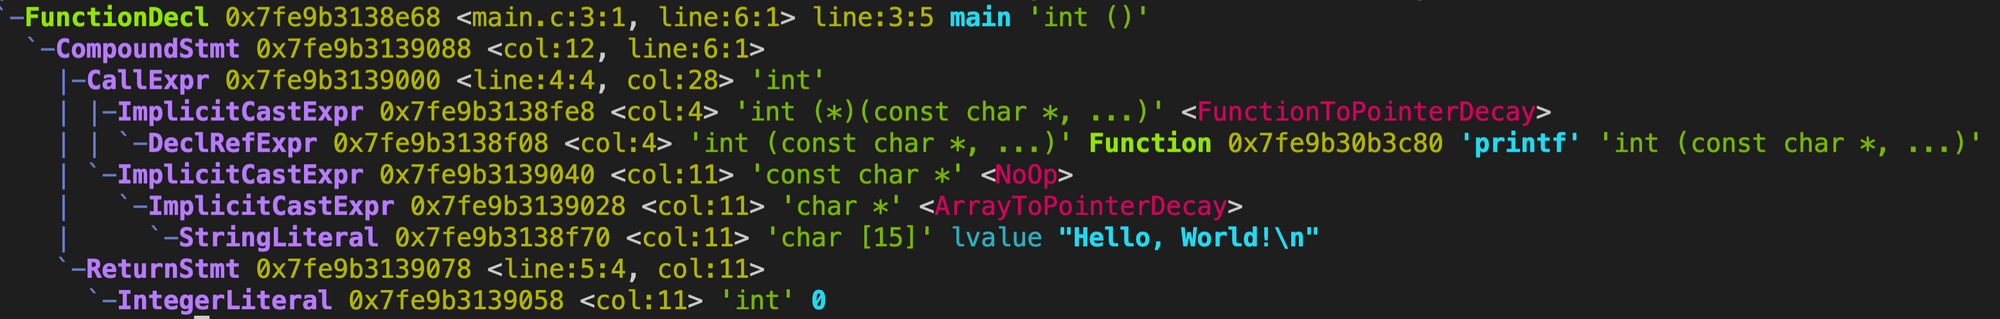
clang -fsyntax-only -Xclang -ast-dump main.cSemantic Analysis
Semantic Analysis ensures the validity of a parse tree by analyzing the data types, incorrect control flows, undefined variables, and any other such issues which will result in an error while running the program. The foremost task of this stage is to make sure the program is valid and will run on a microprocessor. You can read more on this stage at Tutorialspoint.
Code Generation stage
Once the AST has been created, the compiler then proceeds to compile the AST into assembly code. The compiler detects the microprocessor architecture and the supported instructions and generates an assembly program specifically for the processor. We can view the assembly code by adding the -S flag to the clang command.
clang -S main.cRunning the command above will create a file called main.s containing code as shown below. This is the Intel x86-64 syntax for a hello world program in assembly. You can see the printf function being called in assembly. The calllq instruction will move the address of the next instruction following it to the execution stack and move towards executing the commands at the _printf location.
	.section	__TEXT,__text,regular,pure_instructions
	.build_version macos, 11, 0	sdk_version 11, 3
	.globl	_main                           ## -- Begin function main
	.p2align	4, 0x90
_main:                                  ## @main
	.cfi_startproc
## %bb.0:
	pushq	%rbp
	.cfi_def_cfa_offset 16
	.cfi_offset %rbp, -16
	movq	%rsp, %rbp
	.cfi_def_cfa_register %rbp
	subq	$16, %rsp
	movl	$0, -4(%rbp)
	leaq	L_.str(%rip), %rdi
	movb	$0, %al
	callq	_printf
	xorl	%ecx, %ecx
	movl	%eax, -8(%rbp)                  ## 4-byte Spill
	movl	%ecx, %eax
	addq	$16, %rsp
	popq	%rbp
	retq
	.cfi_endproc
                                        ## -- End function
	.section	__TEXT,__cstring,cstring_literals
L_.str:                                 ## @.str
	.asciz	"Hello, World!\n"

.subsections_via_symbols
We will skip going through the assembly code, however, if you want to learn more about it, you can read the Intel x86-64 guide here.
Assembling
In the assembling stage, the assembly code generated by the compiler is converted into machine code i.e 1's and 0's. These are basically .o object files generated by the assembler. What this means is the commands and data will be replaced by opcodes with a specific bit sequence that can be read by the processor. For example the command pushq %rbp , which essentially pushes the value of the register rbp onto the stack, will be replaced by 010101011 which is 55 in Hexcode.
When opened in a text editor this file might seem all gibberish as machine code is not readable, nevertheless, the file can be interpreted by the system and executed as needed.
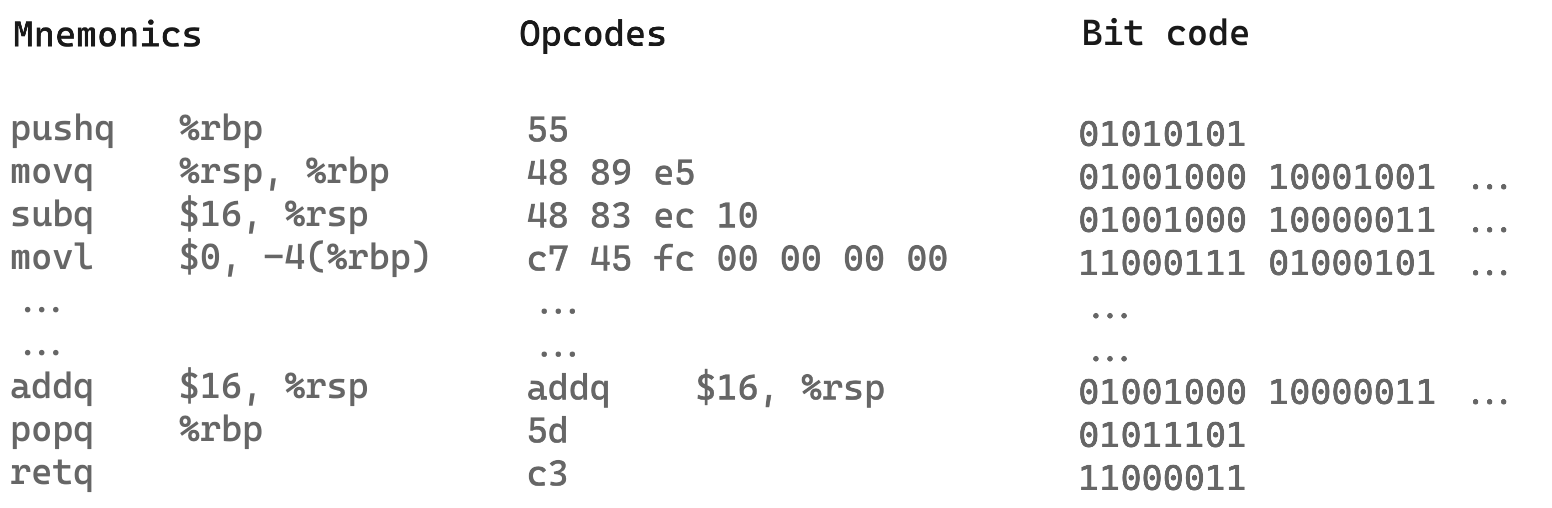
You can view the reference table for opcodes for the x86 architecture here.
Linking
The last step in our compilation process is the linking stage. The linking stage is used to resolve all references in between objects and generate a final executable. The linker combines the object files generated by the assembler into a static executable. It can also resolve dependencies dynamically during runtime using shared objects.
Let's go through some examples.
I'll create a new file called included.c and add the following code to it.
#include <stdio.h>
#include <stdlib.h>


int* charCount(char *string){
    /*
    This function gives the count of each character in a string.
    */
    int *count = calloc(256, sizeof(int));

    for(int i=0; string[i]!='\n'; i++){
        count[string[i]]++;
    }
    return count;
}
The main.c file will look like this.
#include <stdio.h>
#include <stdlib.h>

int* charCount(char *string);

int main() {
   char *value = malloc(256 * sizeof(char));
   printf("Enter a string: ");
   fgets(value, 256, stdin);
   int *result = charCount(value);
   for (int i = 0; i < 256; i++) {
      if(*result > 0) {
         printf("%c: %d\n", i, *result);
      }
      result++;
   }

   return 0;
}
Note that the main.c file does not import the included.c file. All we have in the main.c file is the declaration of charCount. To convert this file into an executable we can pass these files to the clang command and have it output an executable.
clang main.c included.c -o main
./main
This command will compile the files separately into machine code objects and pass them to the linker which will merge them into one executable. We can also compile these files separately and then link them using the clang linker.
clang -c included.c -o included.o
clang -c main.c -o main.o
clang main.o included.o -o main
./main
Our final executable main is now created on the machine. To view the final instructions encoded within the file we can use the objdump tool. The objdump will disassemble our program and display the raw opcodes along with the mnemonics of the program. The output for the hello world program would look like the following.
$ objdump -s --section __text -D --source main

main:   file format mach-o 64-bit x86-64


Disassembly of section __TEXT,__text:

0000000100003f50 <_main>:
/Library/Developer/CommandLineTools/usr/bin/objdump: warning: 'main': failed to parse debug information for main
100003f50: 55                           pushq   %rbp
100003f51: 48 89 e5                     movq    %rsp, %rbp
100003f54: 48 83 ec 10                  subq    $16, %rsp
100003f58: c7 45 fc 00 00 00 00         movl    $0, -4(%rbp)
100003f5f: 48 8d 3d 34 00 00 00         leaq    52(%rip), %rdi  # 100003f9a <dyld_stub_binder+0x100003f9a>
100003f66: b0 00                        movb    $0, %al
100003f68: e8 0d 00 00 00               callq   0x100003f7a <dyld_stub_binder+0x100003f7a>
100003f6d: 31 c9                        xorl    %ecx, %ecx
100003f6f: 89 45 f8                     movl    %eax, -8(%rbp)
100003f72: 89 c8                        movl    %ecx, %eax
100003f74: 48 83 c4 10                  addq    $16, %rsp
100003f78: 5d                           popq    %rbp
100003f79: c3                           retq
When we run the executable, the system kernel loads the program in memory and calls the initial starting address of the program. The binary opcodes are then loaded into memory and executed sequentially. Once the program is called to a halt, the instructions are cleared and the memory is released.
Conclusion
This post describes the compilation process at a very high level. There are a ton of other tasks that execute in the pipeline to make the final executable as optimized as possible. Clang for example converts the AST to LLVM IR which is a platform-independent Assembly Language, before generating the actual Assembly code for the processor. If you wish to learn more on this topic please refer to the resources in the references section.
If you like such content please do consider following me on Twitter. I frequently delve into the internals of software and journal my learnings on this blog, so make sure you also subscribe to it.
References:
- Bare metal embedded lecture-1: Build process. (2020, April 22). [Video]. YouTube. https://www.youtube.com/watch?v=qWqlkCLmZoE
- Comparing C to machine language. (2015, February 9). [Video]. YouTube. https://www.youtube.com/watch?v=yOyaJXpAYZQ
- How do computers read code? (2017, November 16). YouTube. https://www.youtube.com/watch?v=QXjU9qTsYCc
- How LLVM & Clang work. (2020, February 10). YouTube. https://www.youtube.com/watch?v=IR_L1xf4PrU
- How to Load Libraries at Runtime. (2019, February 19). YouTube. https://www.youtube.com/watch?v=_kIa4D7kQ8I
- Answering Your Questions (clang vs gcc, operators, and is web programming a waste of time?). (2020, November 24). YouTube. https://www.youtube.com/watch?v=FPVTr4thm2M
- Preprocessor Output (The C Preprocessor). (n.d.). GCC GNU. Retrieved October 24, 2021, from https://gcc.gnu.org/onlinedocs/cpp/Preprocessor-Output.html
- clang options. (n.d.). Gist. Retrieved October 24, 2021, from https://gist.github.com/masuidrive/5231110
- CS107 Guide to x86-64. (n.d.). Stanford EDU. Retrieved October 24, 2021, from https://web.stanford.edu/class/archive/cs/cs107/cs107.1186/guide/x86-64.html
- J. (n.d.). linear-cpp/main.cpp at master · jesyspa/linear-cpp. GitHub. https://github.com/jesyspa/linear-cpp/blob/master/Chapter%2008%20-%20Using%20Multiple%20Files/main.cpp
- Malewar, S. (2020, August 28). Code Execution, Compiler, Processor, Assembler, Parser, Loader, Linker | GDSC GHRCE. Medium. https://medium.com/dsc-ghrce/how-is-our-code-executed-f81ef6e0bf13
- Compiler Design - Semantic Analysis. (n.d.). Tutorialspoint. Retrieved October 27, 2021, from https://www.tutorialspoint.com/compiler_design/compiler_design_semantic_analysis.htm
- GeeksforGeeks. (2020, April 22). Semantic Analysis in Compiler Design. https://www.geeksforgeeks.org/semantic-analysis-in-compiler-design/
- Understanding C by learning assembly - Blog. (2012, September 12). Recurse Center. https://www.recurse.com/blog/7-understanding-c-by-learning-assembly
- Barbier, J. (2021, June 3). Hack the virtual memory: the stack, registers and assembly code. Blog Holberton School. https://blog.holbertonschool.com/hack-virtual-memory-stack-registers-assembly-code/


